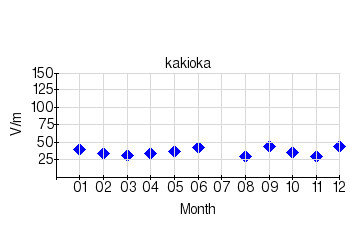
In the figure below are plotted monthly values of the atmospheric electric field to show its variations on longer timescales. They are calculated by averaging exclusively daily mean values of "calm days" that are unaffected by local short-period changes such as due to precipitation.
 |
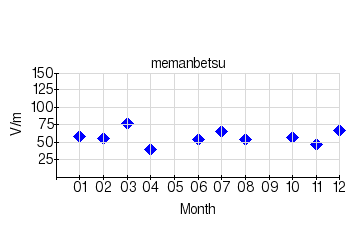 |
| Month | Kakioka | Memanbetsu | ||||
| Calm day | No. of days | Potential gradient (V/m) |
Calm day | No. of days | Potential gradient (V/m) | |
| 1 | 1,2,3,10,14,15,16,19,23,24,31 | 11 | 40 | 5,16,20,27 | 4 | 58 |
| 2 | 6,7,8,11,12,19,24,27,28 | 9 | 34 | 26 | 1 | 55 |
| 3 | 3,13,14,15,26 | 5 | 31 | 6,7,14,16,21,29 | 6 | 77 |
| 4 | 21,27,29 | 3 | 33 | 17 | 1 | 40 |
| 5 | 13,14,21,22,23,28 | 6 | 36 | 0 | ||
| 6 | 4,6,11,12,13 | 5 | 42 | 3 | 1 | 54 |
| 7 | 0 | 6,13,14,15,16,17,30,31 | 8 | 65 | ||
| 8 | 3,6,13,14,16,21,27 | 7 | 29 | 13,14,18,21,23,24,25,27,28,31 | 10 | 53 |
| 9 | 3,8,13,15,16.25 | 6 | 43 | 0 | ||
| 10 | 15,17,21,22,23,24,28,29,31 | 9 | 35 | 21 | 1 | 57 |
| 11 | 3,4,6,12,15,17,20,21,22,24,25,26,28 | 13 | 30 | 2 | 1 | 47 |
| 12 | 2,4,5,6,7,9,10,14,16,17,18,19,20,21,24,25,26,27 | 18 | 44 | 6,11,18,19,22,23,26,27 | 8 | 66 |
Copyright (c) 2024 Kakioka Magnetic Observatory, Japan Meteorological Agency. All rights reserved.