The Data Viewer Program enables visualization of the geomagnetic and geoelectric data included on the CD-ROM as listed below.
 |
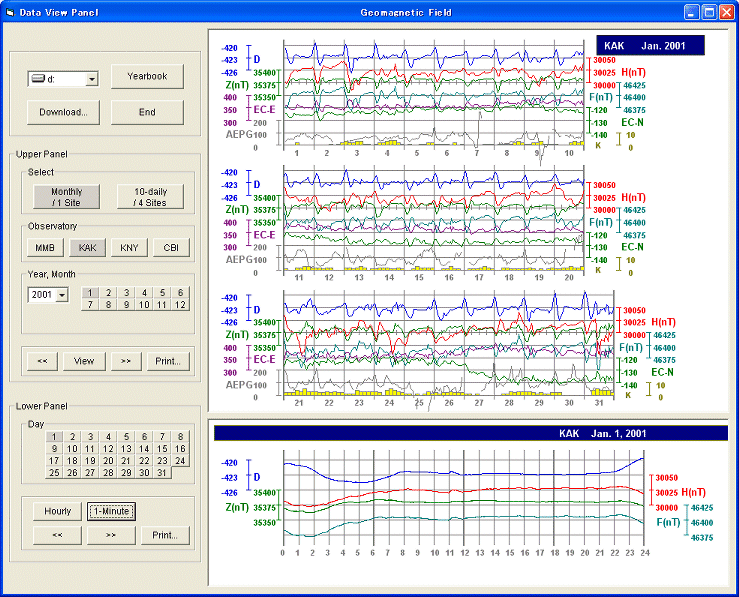
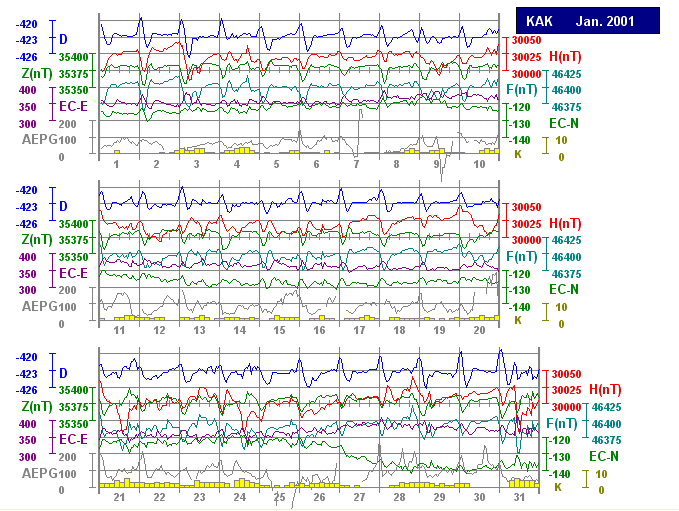
1-month plots of hourly values for individual observatories can be displayed as shown in the example below. The figure shows line graphs of the D, H, Z and F components of the geomagnetic field, the EW and NS components of the geoelectric field, and the vertical component of the atmospheric electric field. Bar graphs of K-indices are also displayed. Different colors are used for individual components and indices.

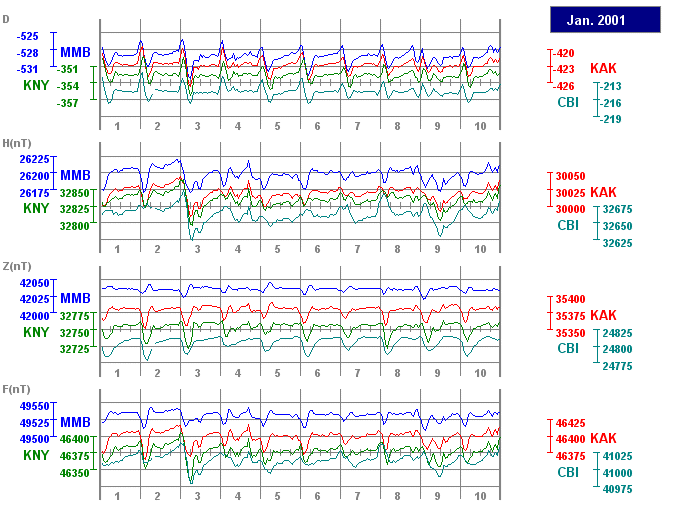
10-day plots can be used to compare observational data of from all four observatories at the same time, as shown in the example below. A different color is used for each observatory.

Hourly values from each observatory are tabulated for individual days as in the following example:

1-minute values from each observatory are plotted for individual days as in the example below. The figure shows line graphs of the D, H, Z and F components of the geomagnetic field.

A table of geomagnetic storms for each observatory (as shown in the example below) is displayed when 1-month plots of hourly values are created.

Copyright (c) Kakioka Magnetic Observatory, Japan Meteorological Agency. All Rights Reserved.